Common Statistical Errors in Breath Research
Published on: 11 Mar 2025
Every time we exhale, we breathe out hundreds of volatile organic compounds (VOCs) that have been produced all over our body. These have the potential to be used as non-invasive biomarkers and have a multitude of clinical advantages. Many candidate breath VOC biomarkers have been identified (1–11), however, despite a large number of breath research studies, there is a lack of replicability in the literature that makes validating select biomarkers challenging. Some of this is due to the intrinsically challenging nature of breath VOCs as candidate biomarkers. There are hundreds, even thousands of VOCs in breath (12,13), which can dynamically change in abundance in response to diet, exercise, medication, circadian rhythms, and other normal fluctuations in physiology like the menstrual cycle (14–20).
With this level of variation, finding and confirming meaningful changes in abundance in specific VOCs poses a difficult statistical challenge. To detect small, but meaningful changes amongst a highly variable dataset needs statistical power, which is only possible with adequate sample sizes in clinical studies. On top of small sample sizes, many breath studies in the literature suffer from a lack of standardization in breath collection and analysis that further hinder replicability. This results in the majority of breath biomarker discovery studies being underpowered to conclude meaningful differences confidently. Overfitting spurious relationships resulting from probability between two groups (i.e. a disease cohort and healthy controls) is common. Ensuring robust statistical analysis and interpretation in breath VOC analysis can significantly improve the quality of breath research publications in the literature, helping to advance breath technology into the clinic. In this blog, we go through four common statistical mistakes, and how to avoid them for more powerful and robust breath study designs.
Not considering demographic factors
As many endogenous VOCs arise directly from metabolic processes in the body, one should consider how VOC composition in the body vary naturally due to demographic factors. For example, aging results in changes to metabolism and body composition, including shifting fat distribution and loss of muscle mass, all of which can impact the VOCs found in breath. This means that having an unequal distribution of older individuals in a disease cohort, or younger persons in a control group in a clinical trial aiming to discover biomarkers for a particular disease can result in age-related differences being published as candidate biomarkers. Ensuring matched controls and study cohorts is a good way to address this. However, the challenge lies in recruitment and this is one of the main causes for delays in the start of a clinical trial. Demographic matching aims to make the control group as similar as possible to your disease groups in every possible way, outside of their disease status. This is achieved by recruiting control subjects that are matched to your disease group for characteristics such as age, sex, BMI, and sometimes lifestyle factors such as smoking status. Collecting all samples from a fixed location can also help to limit the impact of varying environmental air that participants inhale while giving a breath sample. Recording demographic data, even if precise demographic matching is not possible, means that statistical analysis can be conducted to investigate the impact of these potentially confounding variables in your study.
Underpowered studies and over-interpreted results
There are plenty of published examples of small studies with overambitious goals, and overinterpreted data, which limits the impact of results or even renders them unreproducible, especially in larger studies. To avoid confusion, there should be clear metrics that define the success of a trial, and a plan that enables these metrics to be assessed adequately. One of the most common limitations to a study design is budget, however, a well-designed, appropriately interpreted small pilot study can produce the strong foundational results required to secure further funding for larger studies. For clinical studies, this usually involves achieving statistical significance in a comparison between groups, with adequate statistical power. Power is an important statistical concept, and is essentially the probability that a statistical test conducted on the data has produced a finding that is truly present. Statistical power can be calculated based on two key metrics:
- Effect size: how much of a difference between the two groups you expect to see.
- Sample size: the number of participants in your trial.
A power calculation can be used to estimate the optimal number of participants for your particular study design and minimize the chances of a statistical error.
While the specific population that the breath test is intended to be used in should always be used for late-stage trials, in the early stages, specific groups are often selected to maximize the potential to detect differences. For example, a pilot study which is often designed with a smaller cohort is more likely to give conclusive results if you include patients with advanced illness – as the observed effect sizes may be larger. If possible, even with a pilot study, it’s beneficial to be guided by existing knowledge, as the more you can simplify and optimize your analysis around detecting particular compounds, the clearer your results will be. Our Breath Biopsy VOC Atlas® can help researchers at this early stage. The VOC Atlas is a catalog of confidently identified and quantified volatile organic compounds (VOCs) found in exhaled breath. It provides insight and scientific context to already identified compounds which can help enable a strong pre-selection of candidate biomarkers for a variety of diseases and physiological processes.
Lack of appropriate controls
The control group is key to how you interpret your results, and how translatable the results are to the general population for wider use. In most cases, healthy controls will offer the biggest expected difference (effect size) compared to the disease population. This can be further enhanced by comparing controls to advanced stages of disease. While healthy controls can help to identify potential biomarkers, the ability to differentiate healthy from advanced disease is rarely of use in a clinical setting. To match how tests are usually utilized in the clinic, the test would need to be capable of differentiating either between healthy controls and early-stage patients (e.g. for screening purposes) or between diseases with similar types of symptoms (e.g. for a diagnostic test). As differences between these groups are likely to be more subtle (lower effect size), studies will generally need to have more participants in order to obtain the statistical power necessary to detect and be confident in the differences if detected. Larger studies are more expensive to run, but costs may not increase linearly, with the recruitment of demographically matched control groups that also have specific health conditions can be more difficult than recruiting healthy controls. This is why global-scale collaboration between breath researchers can help to spread the costs and maximize the efficiency of trials.
Certain study designs allow participants to act as their own controls. This is most useful when monitoring patients before and after a certain intervention. For example, patient breath can be measured using a crossover trial design where participants are given interventions in a sequence (Figure 1). Our recent collaborative work to identify biomarkers of air pollution used this trial design, whereby participants underwent two separate exposures to either 300 μg/m³ of PM2.5 from a diesel engine, and to filtered air (sham), spaced a minimum of six weeks apart. The participants were randomized and blinded as to which exposure happens first. The representative flowchart of this study design is shown in Figure 1.
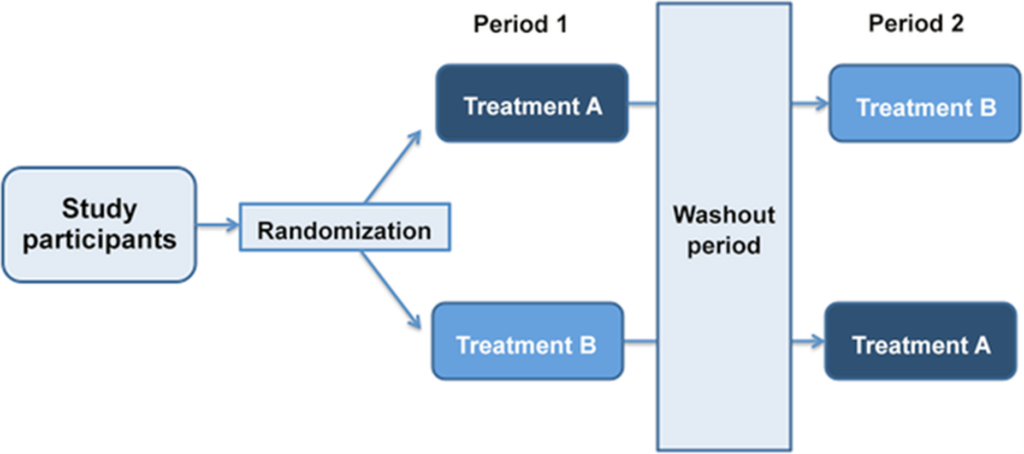
Figure 1. A schematic indicating a cross-over clinical trial design.
Fernandez del Rio et al. employed the approach of using participants as their own controls to great effect, whereby the patients’ breath was analyzed both before and after receiving liver transplants (21). This study resulted in the volatile compound limonene being identified as a potential biomarker of liver disease. Our EVOC® probe approach operates on a very similar principle and can open up the possibility of innovative trial design using patients as their own controls.
Visualizing and inspecting your data
The first step in any analysis of newly acquired data should always be to get a “feel” for the data, and how the experiment turned out, rather than jumping straight into statistical analysis. Generally, this involves visualizing the data, generating graphs to understand how it looks, and what the calculated averages, standard deviations, and data ranges are. Although utilized in the context of assessing how hypothesis-driven research can affect how researchers visualize their data, researchers made up a dataset containing the body mass index (BMI) of 1786 people, together with the number of daily steps taken for men, one for women, and then asked students to analyze it (22,23). In fact, the data contained a waving gorilla if plotted (Figure 2). Many of the students did not discover the gorilla, but students without a specific hypothesis were almost five times more likely to discover the gorilla when analyzing this dataset. The results of this experiment demonstrate that it is easy to skip over the important stage of visualizing and familiarizing yourself with the data, especially if too focused on the hypothesis and end goal you are trying to achieve.
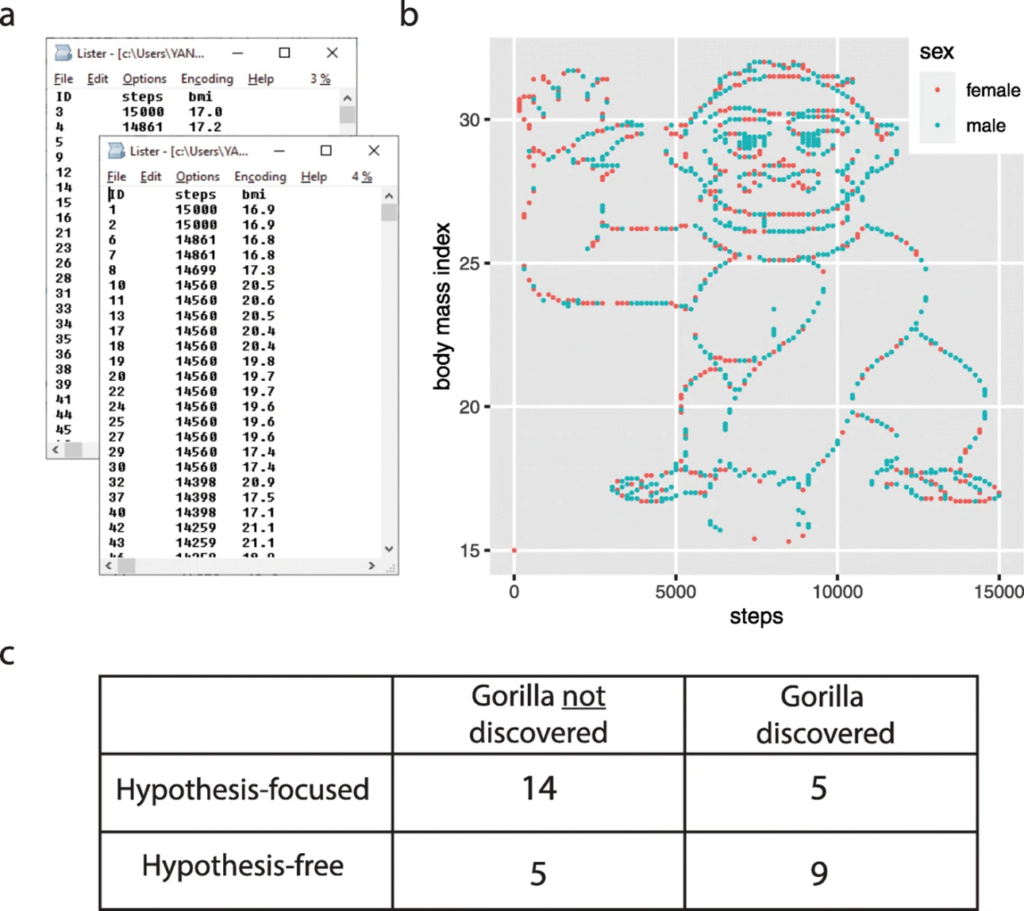
Figure 2 – Image showing the waving gorilla embedded into the data given to students, from Yannai and Lercher et al. (22,23).
We have found that it is very helpful to get all of the data into some form of visual representation, either as bar graphs, cluster plots, or heat maps, depending on the complexity of the data structure. Making note of the summary statistics alongside this visualization (such as the mean, median, interquartile range) can help to gain a feel for the data. Some specific questions to ask yourself during this visual inspection are:
- What is the variance in the data?
- What is the distribution of the data?
- Are there clear differences between groups?
- Are there values that look strange?
Then when moving on to formal statistical analysis, you will need to understand the context of the data that has produced the specific outcome, and how to start troubleshooting if necessary. It is important to take time to understand what your study design is, and ultimately what you want a statistical test to tell you before choosing which test is appropriate. Based on your data, different tests can be appropriate. For example, for comparing two datasets with normal distribution, in which the mean is the best measure for identifying the central position in your data, a t-test could be the most appropriate. However, if you have multiple groups, another test such as an ANOVA could be more appropriate. If you are unsure, reaching out to statistical experts before you start your study design and data collection process is the best way to ensure your study is correctly set up.
If you’re looking for help planning your own breath research studies, please do not hesitate to get in touch, and our team of experts can work with you to see how we can help.
References
- Gashimova EM, Temerdashev AZ, Porkhanov VA, Polyakov IS, Perunov DV. Volatile Organic Compounds in Exhaled Breath as Biomarkers of Lung Cancer: Advances and Potential Problems. J Anal Chem. 2022 Jul 1;77(7):785–810. doi: 10.1134/S106193482207005X
- Haworth JJ, Pitcher CK, Ferrandino G, Hobson AR, Pappan KL, Lawson JLD. Breathing new life into clinical testing and diagnostics: perspectives on volatile biomarkers from breath. Critical Reviews in Clinical Laboratory Sciences. 2022 Jul 4;59(5):353–72. doi: 10.1080/10408363.2022.2038075
- Ibrahim W, Carr L, Cordell R, Wilde M, Salman D, Monks PS, et al. Breathomics for the Clinician: The use of volatile organic compounds in respiratory diseases. Thorax. 2021 May 1;76(5):514–21. doi: 10.1136/thoraxjnl-2020-215667
- Issitt T, Wiggins L, Veysey M, Sweeney ST, Brackenbury WJ, Redeker K. Volatile compounds in human breath: critical review and meta-analysis. J Breath Res. 2022 Feb;16(2):024001. doi: 10.1088/1752-7163/ac5230
- Metwaly S, Psica A, Sogaolu O, Ahmed I, Mukhopadhya A, Delibegović M, et al. Volatile Organic Compounds for the Detection of Hepatocellular Carcinoma – a Scoping Review. iLIVER [Internet]. 2023 Oct 8 [cited 2023 Oct 13]; Available from: https://www.sciencedirect.com/science/article/pii/S2772947823000452 doi: 10.1016/j.iliver.2023.09.001
- Murgia A, Ahmed Y, Sweeney K, Nicholson-Scott L, Arthur K, Allsworth M, et al. Breath-Taking Perspectives and Preliminary Data toward Early Detection of Chronic Liver Diseases. Biomedicines. 2021 Nov;9(11):1563. doi: 10.3390/biomedicines9111563
- van der Sar IG, Wijsenbeek MS, Moor CC. Exhaled breath analysis in interstitial lung disease. Current Opinion in Pulmonary Medicine. 2023 Sep;29(5):443. doi: 10.1097/MCP.0000000000000978
- van Vorstenbosch R, Cheng HR, Jonkers D, Penders J, Schoon E, Masclee A, et al. Systematic Review: Contribution of the Gut Microbiome to the Volatile Metabolic Fingerprint of Colorectal Neoplasia. Metabolites. 2023 Jan;13(1):55. doi: 10.3390/metabo13010055
- Wang R, Davis MD. A concise review of exhaled breath testing for respiratory clinicians and researchers. Respiratory Care [Internet]. 2024 Jan 10 [cited 2024 Jan 15]; Available from: https://rc.rcjournal.com/content/early/2024/01/10/respcare.11651 doi: 10.4187/respcare.11651
- Westphal K, Dudzik D, Waszczuk-Jankowska M, Graff B, Narkiewicz K, Markuszewski MJ. Common Strategies and Factors Affecting Off-Line Breath Sampling and Volatile Organic Compounds Analysis Using Thermal Desorption-Gas Chromatography-Mass Spectrometry (TD-GC-MS). Metabolites. 2022 Dec 21;13(1):8. doi: 10.3390/metabo13010008
- Chou H, Godbeer L, Allsworth M, Boyle B, Ball ML. Progress and challenges of developing volatile metabolites from exhaled breath as a biomarker platform. Metabolomics. 2024 Jul 8;20(4):72. doi: 10.1007/s11306-024-02142-x
- Drabińska N, Flynn C, Ratcliffe N, Belluomo I, Myridakis A, Gould O, et al. A literature survey of all volatiles from healthy human breath and bodily fluids: the human volatilome. J Breath Res. 2021 Apr 21;15(3). doi: 10.1088/1752-7163/abf1d0
- Arulvasan W, Chou H, Greenwood J, Ball ML, Birch O, Coplowe S, et al. High-quality identification of volatile organic compounds (VOCs) originating from breath. Metabolomics. 2024 Sep 6;20(5):102. doi: 10.1007/s11306-024-02163-6
- Ajibola OA, Smith D, Španěl P, Ferns GAA. Effects of dietary nutrients on volatile breath metabolites. Journal of Nutritional Science. 2013 ed;2:e34. DOI: 10.1017/jns.2013.26
- King J, Kupferthaler A, Frauscher B, Hackner H, Unterkofler K, Teschl G, et al. Measurement of endogenous acetone and isoprene in exhaled breath during sleep. Physiol Meas. 2012 Mar;33(3):413–28. DOI: 10.1088/0967-3334/33/3/413
- Sukul P, Richter A, Junghanss C, Schubert JK, Miekisch W. Origin of breath isoprene in humans is revealed via multi-omic investigations. Commun Biol. 2023 Sep 30;6(1):1–12. DOI: 10.1038/s42003-023-05384-y
- Wilkinson M, Maidstone R, Loudon A, Blaikley J, White IR, Singh D, et al. Circadian rhythm of exhaled biomarkers in health and asthma. Eur Respir J. 2019 Oct 17;54(4):1901068. DOI: 10.1183/13993003.01068-2019
- Kagaya M, Iwata M, Toda Y, Nakae Y, Kondo T. Circadian rhythm of breath hydrogen in young women. J Gastroenterol. 1998 Aug;33(4):472–6. DOI: 10.1007/s005350050117
- Sukul P, Schubert JK, Trefz P, Miekisch W. Natural menstrual rhythm and oral contraception diversely affect exhaled breath compositions. Sci Rep. 2018 Jul 18;8(1):10838. doi: 10.1038/s41598-018-29221-z
- Miekisch W, Sukul P, Schubert JK. Diagnostic potential of breath analysis – Focus on the dynamics of volatile organic compounds. TrAC Trends in Analytical Chemistry. 2024 Nov 1;180:117977. DOI:10.1016/j.trac.2024.117977
- Fernández del Río R, O’Hara ME, Holt A, Pemberton P, Shah T, Whitehouse T, et al. Volatile Biomarkers in Breath Associated With Liver Cirrhosis — Comparisons of Pre- and Post-liver Transplant Breath Samples. EBioMedicine. 2015 Jul 26;2(9):1243–50. DOI: 10.1016/j.ebiom.2015.07.027
- Yanai I, Lercher M. Selective attention in hypothesis-driven data analysis [Internet]. bioRxiv; 2020 [cited 2024 Sep 26]. p. 2020.07.30.228916. Available from: https://www.biorxiv.org/content/10.1101/2020.07.30.228916v1 DOI:10.1101/2020.07.30.228916
- Yanai I, Lercher M. A hypothesis is a liability. Genome Biology. 2020 Sep 3;21(1):231. DOI: 10.1186/s13059-020-02133-w